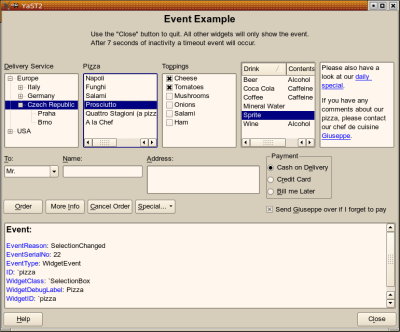
Programming a GUI version of “Hello, World” is easy in the YaST programming environment, no matter if it’s YCP (the YaST-specific scripting language), plain C++, Perl, Python, or Ruby.
But if dialogs become more complex, it can get demanding to make them look good and – equally important – to behave well as the user resizes dialogs:
The YaST UI (user interface) engine now features a new debugging tool to make life easier for developers: YDialogSpy. In the Qt version, hit the magic key combination
Ctrl-Shift-Alt-Y
and you will get a YDialogSpy window like this:
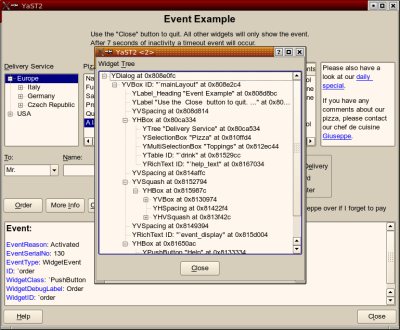
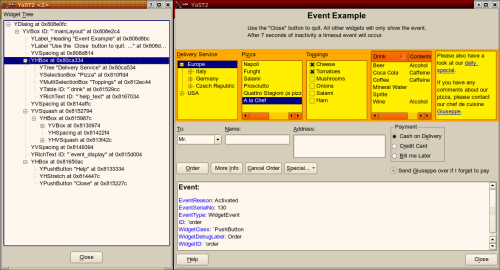
This shows the widget hierarchy of the original dialog as a tree. Clicking around in that tree, you can highlight the corresponding widget (and its child widgets) in the original dialog (move the YDialogSpy window to the side first):
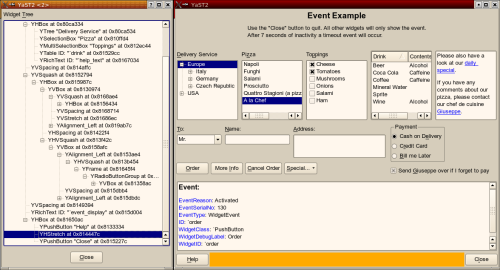
This can also make widgets visible you normally can’t see such as H/VSpacing, H/VStretch etc., and it shows the extent of alignment widgets (left, right, top, bottom) as well as layout boxes (H/VBox):
Availability
yast2-libyui-2.17-9 or later
yast2-qt-2.17.8 or later
The Future
This is just a first version, of course. Future versions will get a “Properties” table that can show certain values of the current widget. Maybe there will also be some (very limited) editing capabilities.
Stay tuned.
Further Reading
http://en.opensuse.org/YaST/Development/Misc/YDialogSpy
(With original-size screen shots)
Both comments and pings are currently closed.