The hackweek project I worked on was to implement a live graphing utility for per process I/O data. See https://features.opensuse.org/306941 (Yes, I added the fate request, just now, after doing most of the work.)
Screen-shots, RPM download link, project homepage link,..
The main idea behind choosing to work on this was to do some GUI programming on a modern language. I work on the linux-kernel(so no gui) and most of the time I write ‘C’ programs.(In fact, at times even when bash would be appropriate!)
So I decided to do this and had to choose between moonlight and Java. My experience with C# was nil, and moonlight was an applet/flash equivalent not aimed at desktop apps.(Yes, there are desktop applications in flash. Even mono has mopen) I thought that I would have to access procfs and might also need to do netlink sockets and moonlight could be a problem. And the real benefit of flash is the the IDE/designer for development, which anyway moonlight is yet to get. In the end, I chose Java.(was a tough fight with C# but again gtk# versus winforms…)
And here it is..

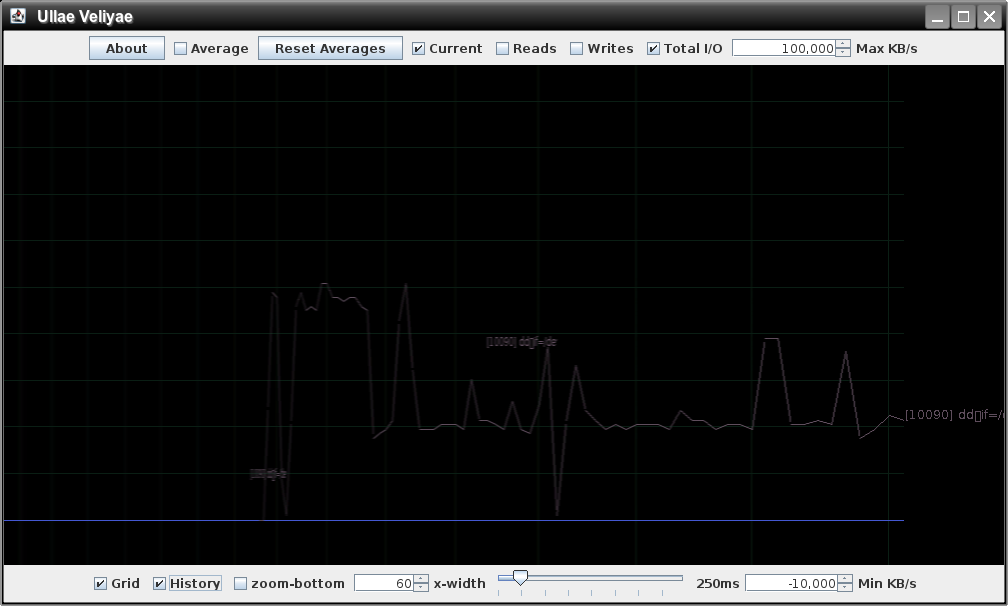
watching dd...

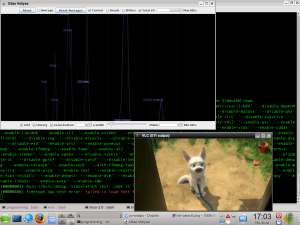
Watching vlc reading from disk as I seek
You can download it from http://download.opensuse.org/repositories/home:/nikanth/ The source is also available at http://gitorious.org/ullae-veliyae/
RPM quick Links:
[Yes, it should be made as no-arch! ;)]

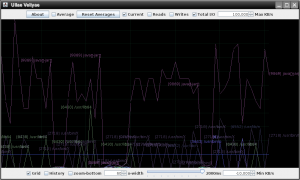
chaos
If you are trying it out, see whether you can find an easter egg? 😉 [Yes, it is kind of lame to have easter-eggs on a open-source project with just hundreds of LOC] The easter egg is an hidden functionality.
I should thank Vojtech Pavlik, for his very useful ideas of “history”, such that we can squeeze the historical data and keep it for longer duration. And another idea of showing average of the data instead of current data, as it tends to be spiky. I haven’t implemented rolling-window for the average though.
A picture is worth 1000 words, but trying it out yourself is worth much more than that. So play with this once. 🙂
Both comments and pings are currently closed.
Good job. Well done. congrats.
Apart from those managerial words ;-), I really felt it is useful and a wonderful tool. It reminded me a little about iogrind, iotop etc. A nice graphical tool is always helpful. May be you can get this integrated with gnome-system-monitor or some such tool as well.
Why someone want this if other defaults and good tools like gnome system-monitor are available
AFAIK gnome-system-monitor won’t show you graph for per-process data. It would only show a ‘top’ like list only in words. So it is difficult to see the big picture including some history.
Moreover, this was done just for fun, and didn’t intend to become a serious tool. And at times, I do want to see graphs for this kind of data.
UPDATE:
Graphs for CPU % per process was the easter egg, which now has been refined and made as a known functionality.
RPM: http://download.opensuse.org/repositories/home://nikanth/openSUSE_11.1/noarch/ullae-veliyae-1.0-13.1.noarch.rpm
And being a Java util, it’s changed as a no-arch RPM now.