After releasing WebYaST 1.0 last week we have had a look to the status module again and have come to the conclusion that we can do it better. 🙂
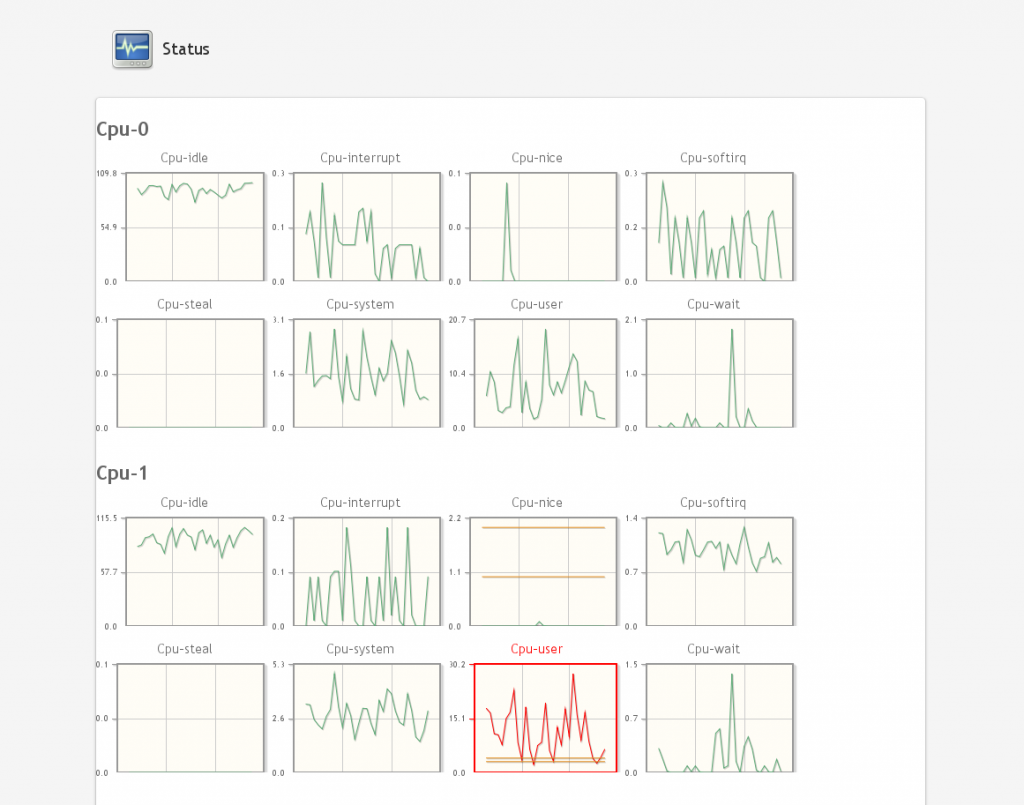
The current version looks more like a medical monitoring system that no one understand:
Technical background
The system data will be collected by a service called collectd (www.collectd.org). This data will be stored in a rrd-database which is located in
/var/lib/collectd/<system-name>/[cpu-0|cpu-1|df|interface|load|memory|….]
An own file/database will for each value will be generated.
The upper screen shot shows that an own graphic will be shown for each value. This is not really user friendly. We would like to show only values which provides “really” interesting information for the sysadmin or user. These values should also be grouped in order to reduce the amount of graphs.
Another lack of information is the labeling of the graphs. There is no description what the values mean and in which period they have been evaluated.
The aim
would be to give the user a nice overview about the system status. Additional, there should be an alarm system available if system values are exceeded. E.g. there should be sent an email to the system administrator if no disk space is available anymore.
The Administrator should also be able to configure “his” needed system values in a nice way.
Suggestion for configuration
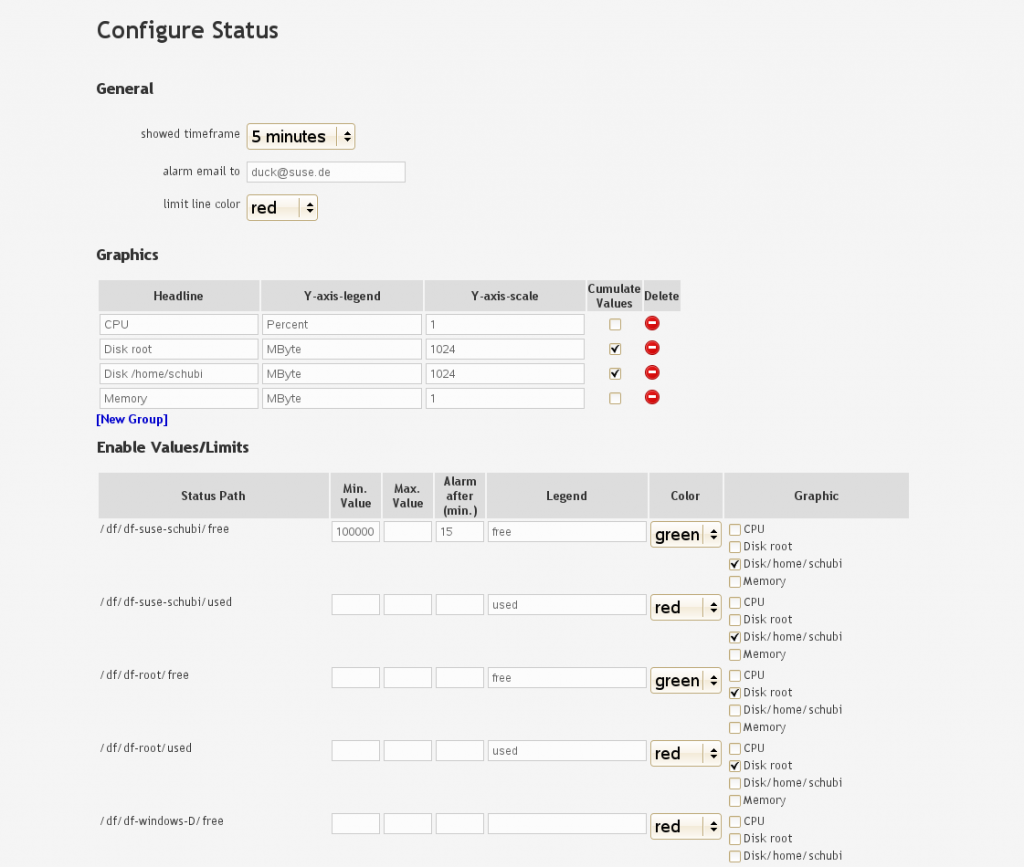
There are three parts:
- General
General setting like period time of shown data, email address in the case of occurred errors and the color of displayed limits. - Graphics
Defining graphs with- labels
- scales
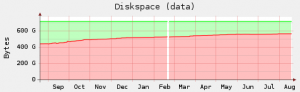
- flag for cumulate values
This means that the values in the graph are added. E.g. the component df of collectd returns two values of a partition (free, used). These values will be cumulated in the graph like this:
- Enable Values/Limits
- Defining which data of collectd will be shown in the graphics described above. This enable us to group data in one graph, defining color and label of each collectd value:
- Defining limits and send an email if the value is overstepped longer than the defined period (Alarm after (min.))
- Defining which data of collectd will be shown in the graphics described above. This enable us to group data in one graph, defining color and label of each collectd value:


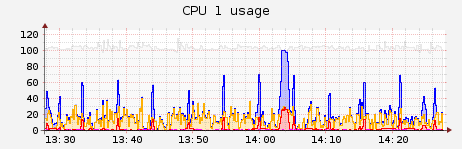
The Result
should be an amount of view graphs which include interesting data only. These values are checked periodically and an email will be sent if they exceed a defined limit.
I am asking for
your opinion about:
- Do you know a much more fancy way for displaying system status data ?
- Which kind of Data would be interesting for you (CPU, memory, disk-space,….)?
- When and for which kind of data would you like to get an email if limits have been exceeded?
So, before changing this module we would like to ask you what you would like to see. 🙂
Thanks in advance.